by Ludwig Scheibe (TU Berlin), November 2024
A planet’s atmosphere, that means the gas layer that envelopes it, provides us with valuable information about the conditions present there. It has a critical role in the planet’s heat balance, tells us about processes in its interior and evolution, and can give clues about possible habitability. So how can observations tell us about the atmosphere of a distant world that we cannot even see?
It’s the same for atmospheres as for most areas of exoplanet research: different methods give different jigsaw pieces, and not all planets are suitable for all methods. All of the methods have in common that we observe the light from the planet’s star at different wavelengths, or in other words colors. This is called using the light’s spectrum and the basics of that concept is explained here.
The phase curve
The phase curve of a transiting planet, whose orbit is oriented such that it regularly passes between us and its host star, is the measured brightness over a complete orbital cycle. After the strong dip in brightness when the planet passes in front of the star – so-called primary transit, the brightness gradually increases over the next half orbit, as more and more of the illuminated – and thus reflecting – side of the planet faces us. When the planet passes behind the star from our point of view, the so-called secondary transit or eclipse, the brightness decreases again, because now only the light from the star itself reaches us, and not anything given off or reflected by the planet.

Schematic view of an exoplanet’s orbit and the correspondent brightness level of the phase curve. The light curve in the lower half is a foreshortened 3D depiction of the idealized brightness progression over one orbit. Credit: ©ESA
This can give us several bits of info: When comparing the brightness directly before and after the primary transit with the secondary eclipse, we can calculate how much radiation the planet’s night side, that means the side that points away from the star, gives off. This can tell us the temperature on the planet’s night side. It works best in the infrared wavelength range, because very few planets are hot enough to emit visible light themselves. A similar comparison and calculation can be made for the other points during the phase curve, to obtain knowledge about the different temperatures on the day- and night side.
Conversely, measuring the visible light, again comparing the brightness progression of the phase curve with the secondary eclipse, lets us know how strongly the planet’s atmosphere reflects light directly. That in turn can tell us whether the planet has clouds and what they might be made of.
Transmission spectroscopy
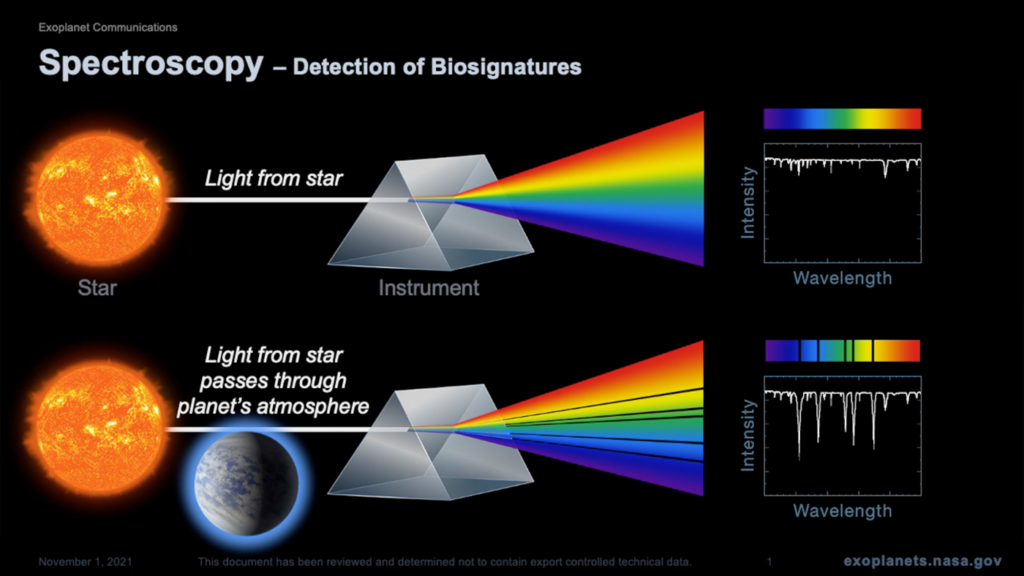
During the primary transit, that is when a planet passes between us and its star, it blocks part of the starlight. But a small part of the starlight is not simply blocked, but passes through the small “ring” that is the atmosphere around a planet. The atmosphere changes the light spectrum, and different colors of the starlight are absorbed with different strengths, depending on what the atmosphere is made of. The strength of the absorption depending on the light wavelength is called the transmission spectrum.

Schematic view of the principle behind transit spectroscopy. Upper part: spectrum of the star’s light without a planet in the way. Lower part: Light passes through a planet’s atmosphere and its spectrum is changed by that. Credit: NASA/JPL
To analyse these spectra, they are compared with computer simulations of the atmospheres with different compositions, and we try to find the best fit to the measured values. The larger the planet and the more extended the atmosphere, the stronger is the absorption effect, This is why we have used this method primarily for Jupiter- and Neptune-sized gas planets and are only now slowly pushing towards being able to do it for rocky planets.

ransmission spectrum of the hot Jupiter WASP-96b, measured with the James Webb Space Telescope. Strength of absorption is plotted over the light wavelength. White: measured points, blue: spectrum of the best-fit computer model. Spectral signatures of certain materials are labeled. Credit: NASA, ESA, CSA, STScI
By the way: our atmosphere on Earth also changes the light coming from outside. This is one of the big advantages of space telescopes, like Webb, over ground-based observations.
Emission spectroscopy
Similar to the absoprtion of the starlight, the atmosphere’s composition also influences the radiation the planet emits itself, usually in the infrared range. As we already saw with the phase curve, the emitted radiation can be especially well measured directly before and after the the secondary eclipse. If this radiation is broken down by wavelength, we can find distinct signatures of certain molecules.
There is another way to measure a planet’s radiation, albeit using a different kind of observation for which most transiting planets found to date are unsuitable: If we can directly image a planet, this also allows us to measure the planet’s light at different wavelength, this time directly. This also gives us an emission spectrum that tells us about the atmosphere’s temperature and composition.

Emission spectrum of the directly imaged exoplanet VHS 1256 b, measured with the James Webb Space Telescope. It plots the strength of emitted radiation over the light’s wavelength in white. The colored stripes show, which parts of the spectrum were used to identify which molecule in the atmosphere. Credit: NASA, ESA, CSA, J. Olmsted (STScI), B. Miles (University of Arizona), S. Hinkley (University of Exeter), B. Biller (University of Edinburgh), A. Skemer (University of California, Santa Cruz) under CC BY 4.0
